CASE STUDY
Customer Status & Revenue Dashboard
Category
Professional
Year
2026
Role
Data Analyst
Client
PT Andromega Data Nusantara
Tentang Project
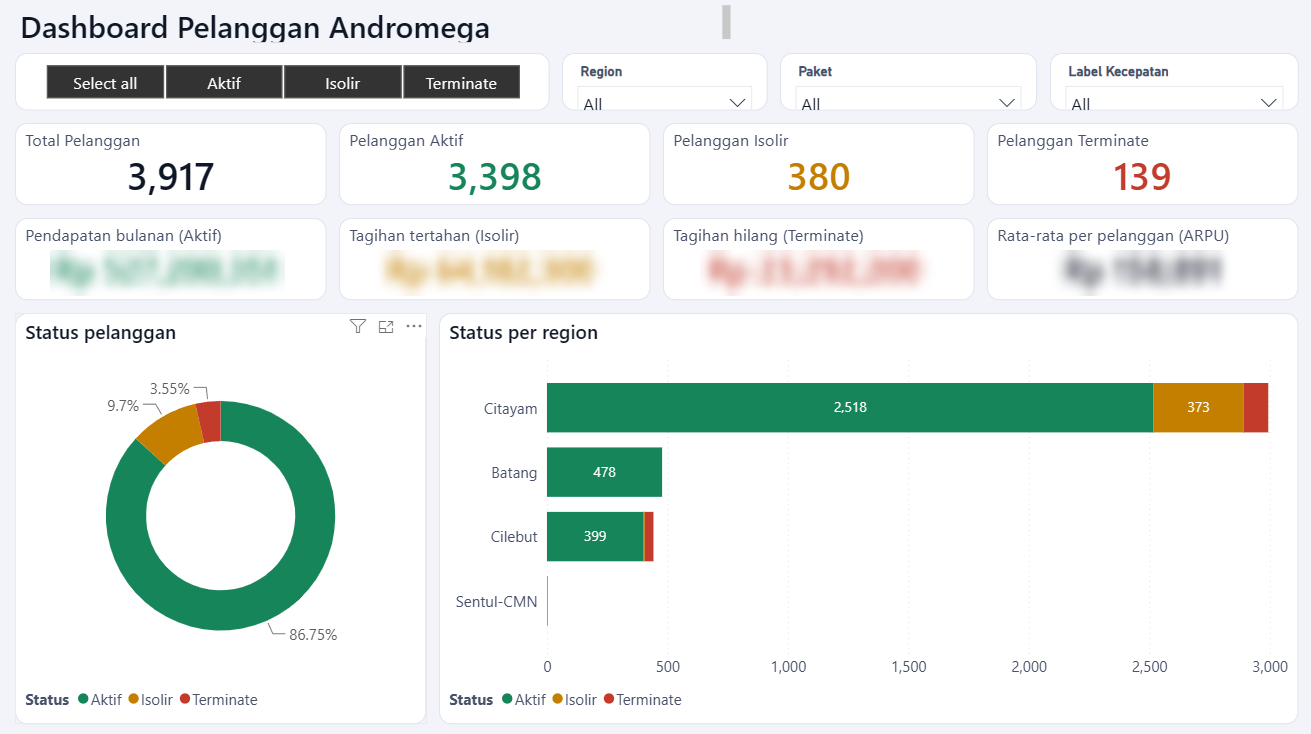
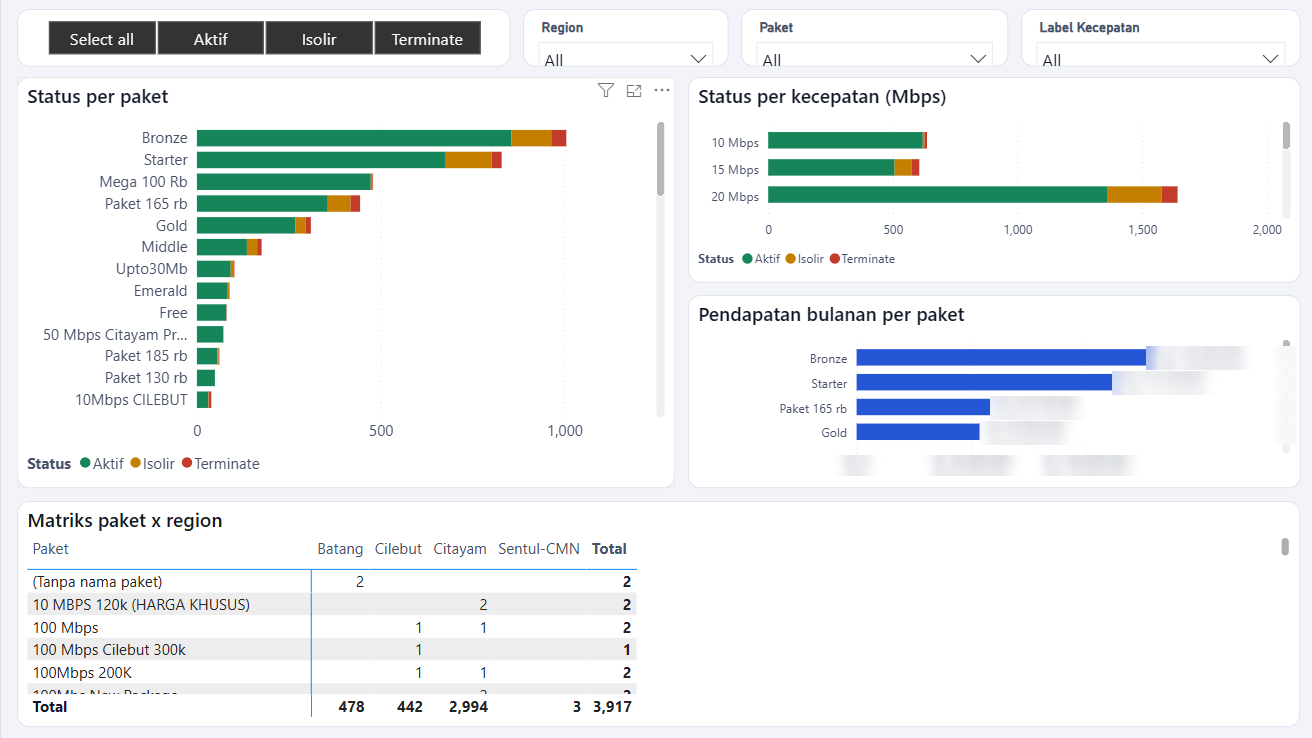
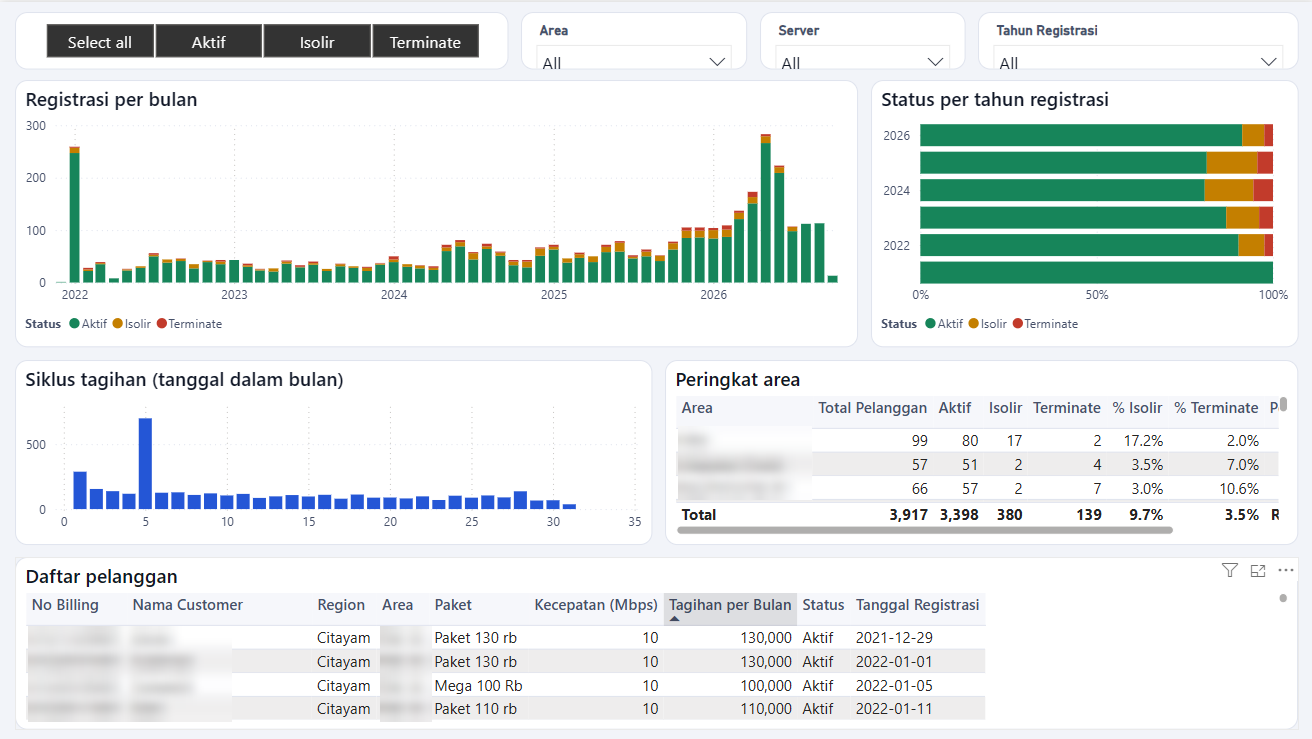
Problem: Customer, package, and billing data was spread across several sources, making it hard to see customer status and revenue at a glance. Approach: I cleaned and transformed the data with Power Query and SQL, then built a three-page interactive Power BI dashboard: a customer status and revenue overview, a breakdown by package and speed, and a registration trend and area analysis. Each page has slicers for status, region, package, and registration year. Outcome: Stakeholders can track active, suspended, and terminated customers in one place and compare performance by region, package, and area. Customer names, billing numbers, and revenue figures have been masked for confidentiality.
Tools
Galeri
Click an image to enlarge